Why Beta is Useless for Options Trading
When you open an options position, you’d like to have the highest confidence that if the stock moves, it’s going to move in the direction you want it to. Chart analysis indicating known patterns can help with this, showing you which direction the momentum is heading, or likely to move. It also helps to know that the stock isn’t very volatile, or likely to switch directions unexpectedly.
When talking about volatility and stocks, one of the greek terms that might get brought up is Beta. While Beta is a measure of volatility, it’s not the one you’re looking for. I’ll tell you why.
What is Beta
Beta is a measure of the volatility of a security compared to the market as a whole. The lower the Beta, the less volatile a stock is, and a higher Beta indicates more volatility. Stocks with betas higher than 1.0 can be interpreted as more volatile than the market it resides in. Simply put, beta is a a measure of volatility.
I don’t want to get statistical with you, but Beta is nothing more than the slope of a line that goes through a series of data points. These data points are the stock’s returns compared to the market, and these data points are from a long period of time.
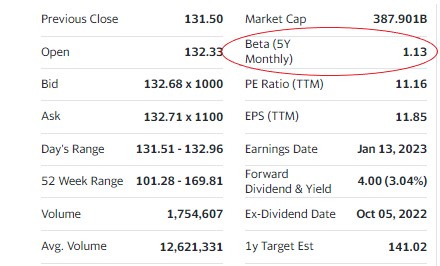
If you look at Yahoo! Finance, you’ll see that stock Beta’s shown here are the 5-year monthly average.

What is Volatility
Volatility, when referred to in options trading, is a measure by which the individual stock is expected to fluctuate over a given period of time. It is the amount by which the underlying stock can change during the life of the option. In options trading, the expected, or implied, volatility, is often measured against actual historic volatility.
For example, if Apple’s stock ($AAPL) has an annual volatility of 40%, then it would be expected to move up or down 40% in price on an annual basis. The volatility is based on it’s own independent movement.
Notice how this is different than Beta. If Apple’s stock has a beta of 1.22, it would be expected to move at a rate of 122% of the fluctuation of the Nasdaq. Beta is the stock’s movement relative to the index.
Tying this back to options, a stock with a high beta (greater than 1), offers the possibility of a higher rate of return, but also poses more risk. But if you found a company in that same industry with a beta of 0.8, this would tell you that the company is less volatile than the market as a whole, and relatively stable compared to its industry.
Depending on which strategy you use, this could be good or bad based on whether you are looking for price stability or rapid price growth. But, this looks out over a long horizon, and is based on a long history. Not so good when you’re opening a position that expires next week
Who uses Beta
Beta is used out there, but it’s more for Portfolio managers and sophisticated traders with large portfolios of stocks. They can either increase or decrease their exposure to the market using the beta calculations to help hedge their portfio.
Beta is an important data point for looking at things on a large scale like this. But it’s just not going to help you understand the potential volatility of any given stock in the short term. When you’re discussing short term options, Beta and volatility are not the same thing.
If not Beta, How can you determine short term volatility?
This is the question we really want answered, how do I know a stock isn’t going to reverse course on me in two days. If I open a trade expecting a stock to maintain its current stability, and then tomorrow it drops significantly, chances are I just lost a bunch of money. So how do I know this won’t happen?
This is where you have to look at the calendar. Know what’s going on that could affect that stock over the next couple weeks. Here are some of the things you should note:
Earnings Releases
Any time a public company has an earnings release, the stock is likely to react. Beat expectations, and the stock might jump. Miss expectations, and the stock might drop. Both of these are likely to be signifant, and can easily take your position into a loss.
Major Competitor Earnings Release
It’s not just the company whose stock you’re opening the options position on that you have to watch. When major competitors have surprises in their earnings release, it can also affect your company. Sometimes these are going to be macro events, which will make companies stocks move in parallel. And somethimes one company will stumble, opening the door for the other to capitalize on market share. In a case like that, the stocks might move in opposite directions.
Fed Interest Rate Changes (up or down)
This is most critical when rates are heading in one direction or the other. It becomes a game of chicken to see how far they’re going to move, and how the market is going to react to it. This is one of the things that affects all stocks, not just one company. But it won’t matter to you that every other stock is moving, just that your stock is moving too.
CPI and PPI releases (especially when inflation is a concern)
When inflation is high, or climbing, traders are going to be keeping a close eye on the price indexes. When these rise or fall faster or slower than expected, it can cause large movement of markets. This is another one that affects markets broadly.
Planned product Launches
Getting back to company specific items, a new product or service launch can cause a stock to move dramatically. If it’s an unexpected new product, or a product that dissapoints, stock movement can be pretty significant.
Identify the Causes of Volatility and Reduce it’s chances of Affecting You
It’d be nice to have a single data point to look at when we want to know if a stock is likely to move much. but the fact is, there just isn’t one. Beta definitely doesn’t give us what we need. But that doesn’t mean we can’t mitigate the volatility risk. You just have to know what things to look for before you open your position. If there aren’t any events like we covered coming up, chances for significant movement by your stock are much lower. Combine this with some basic chart analysis, and volatility becomes a much smaller item to deal with.


